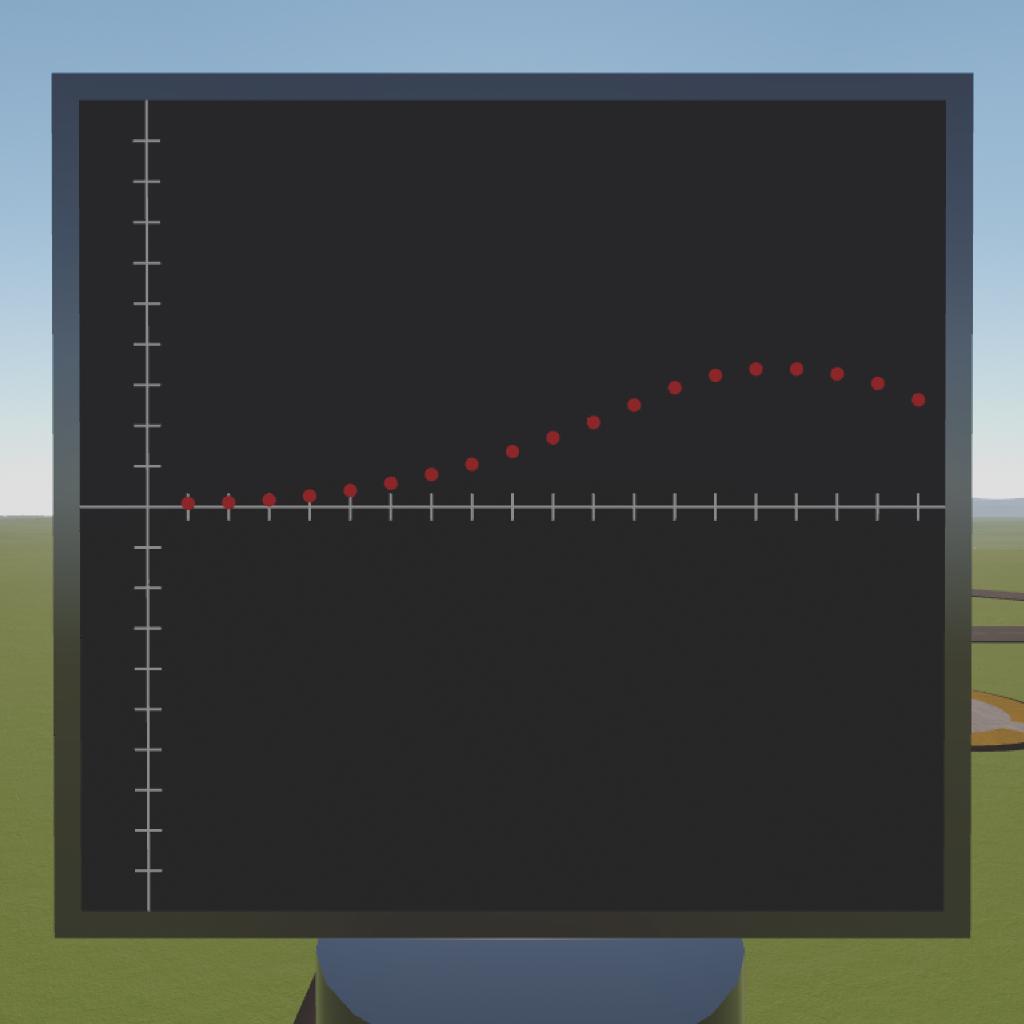
Working graph that can display any input accessable in vizzy in a certain time period.
The input (for example altitude), the delay between each time step aswell as the maximum y-value that can be displayed can be adjusted in the vizzy program.
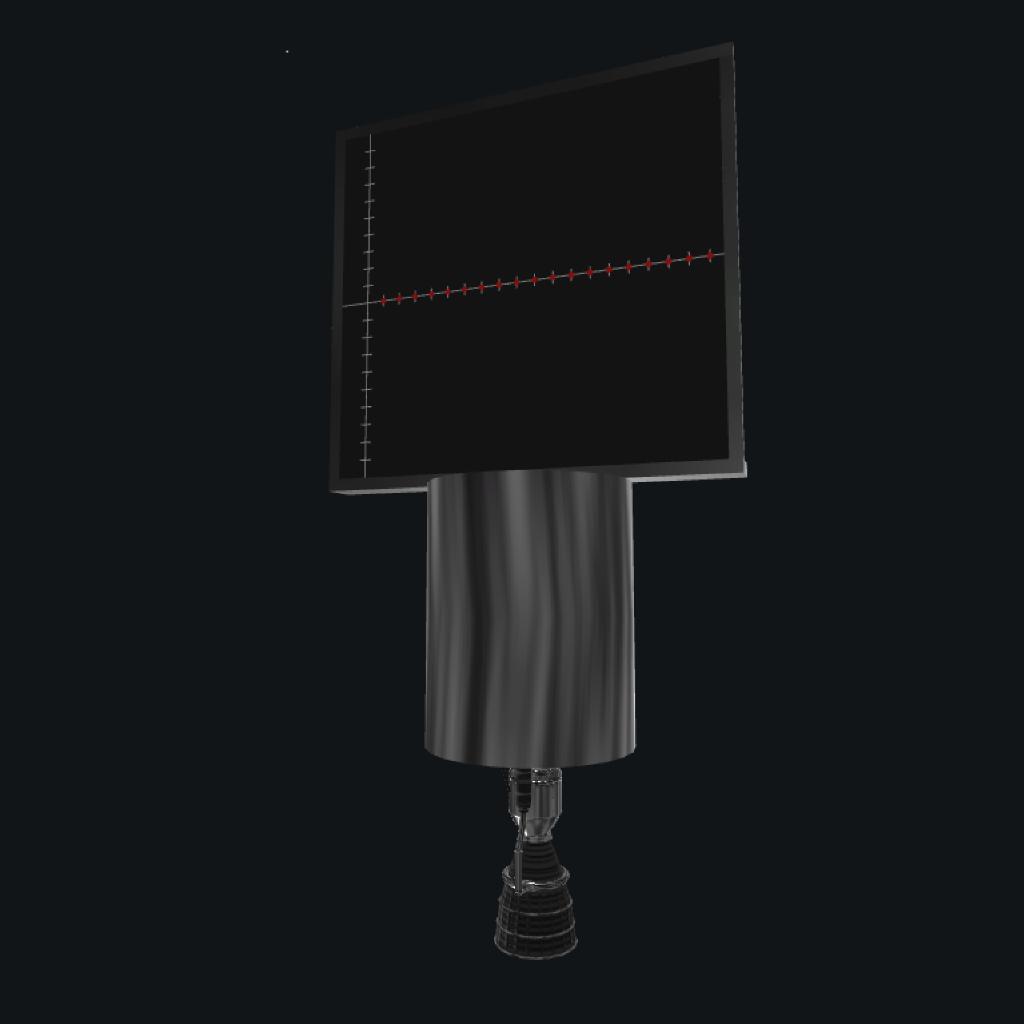
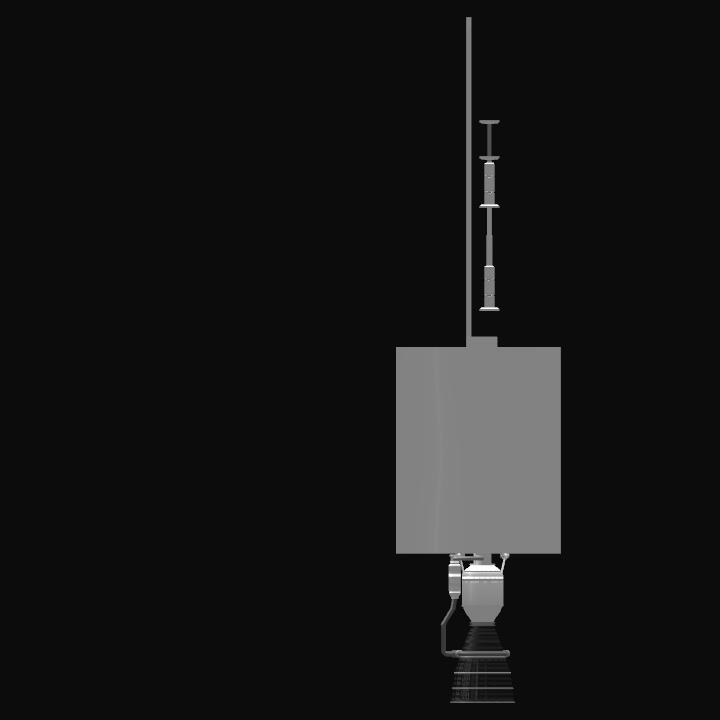
The graph has a rocket attached to it and is set to graph the altitude AGL, just launch the rocket and press AG1 to start the program. When the graphing is done you can press AG1 again to reset the graph.
You can keep recording and resetting as long as you can fly.
Feel free to use this for your own purposes if you want.
GENERAL INFO
- Successors 1 craft(s)
- Created On: Windows
- Game Version: 0.8.402.0
- Price: $1,244k
- Number of Parts: 108
- Dimensions: 7 m x 3 m x 4 m
PERFORMANCE
- Total Delta V: 1.1km/s
- Total Thrust: 87kN
- Engines: 1
- Wet Mass: 6,016kg
- Dry Mass: 3,755kg
STAGES
| Stage | Engines | Delta V | Thrust | Burn | Mass |
|---|---|---|---|---|---|
| 1 | 1 | 1.1km/s | 87kN | 63s | 6,016kg |
9 Comments
- Log in to leave a comment
-
10.9k Insanity4.9 years ago
@lordvader0219 though i am working on a better version which dynamically changes the y-scale and keeps scrolling to the right to show you new values. You will probably also be able to compare two values, running at the same time.
-
10.9k Insanity4.9 years ago
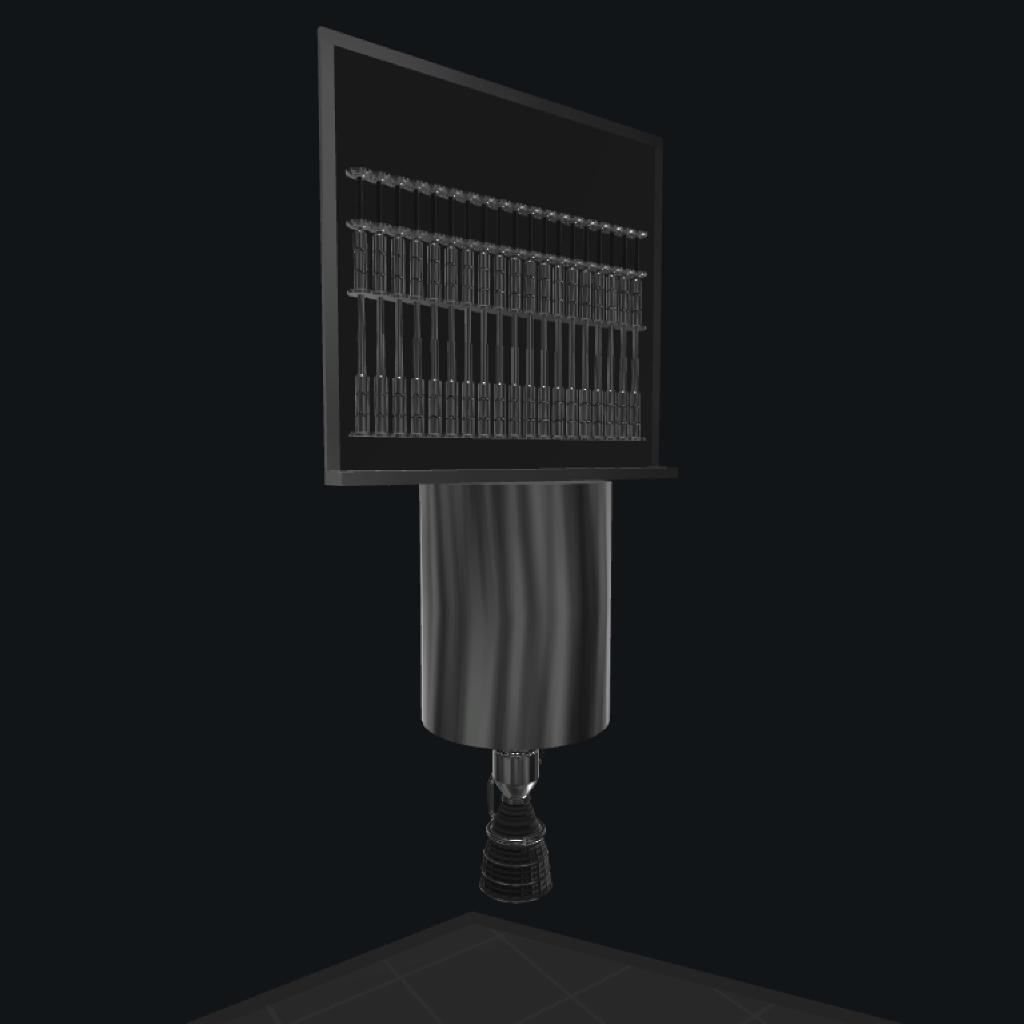
@lordvader0219 this is just a few small fuel tank connected to a couple of pistons being fed information from a vizzy program in an orderly fashion.
If you are talking about somehow running a game through vizzy and then somehow displaying it in flight, with the limited amount of output channels that we have to work with, in a reasonable resolution, then i will have to sadly (and luckily for my sanity) dissapoint you. -
-
-
-
-
-


When you can’t afford TI calculator